We know how important analytics are to running a successful video business. Zype’s single-pane-of-glass dashboard offers extensive data that is presented in a simple format for quick and accurate insights.
The Zype analytics dashboard offers over 20 different metrics so you can make effective business decisions.
The dashboard gives you insights into:
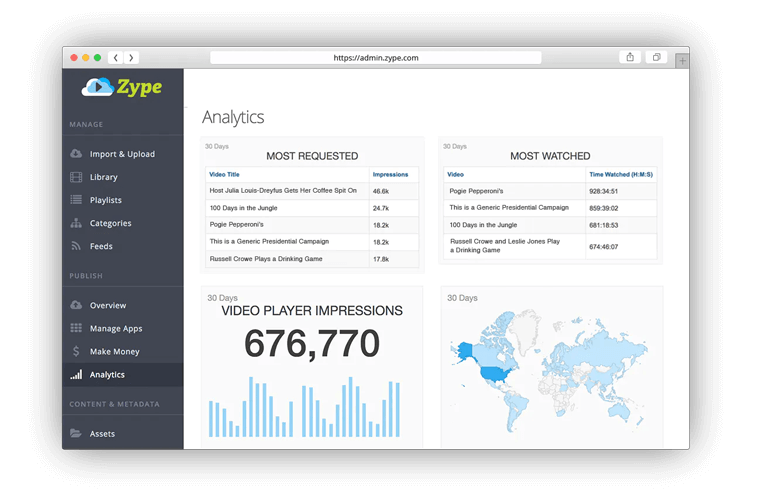
Most Requested videos broken down by video title and impressions over the last 30 days.
Most Watched videos broken down by video title and time watched (H:M:S) over the last 30 days.
Video Player Impressions shows the total number of player impressions per day for the last 30 days.
Video Player Impressions - Geography shows the total number of player impressions in relationship to geography of the requesting consumer over the last 30 days.
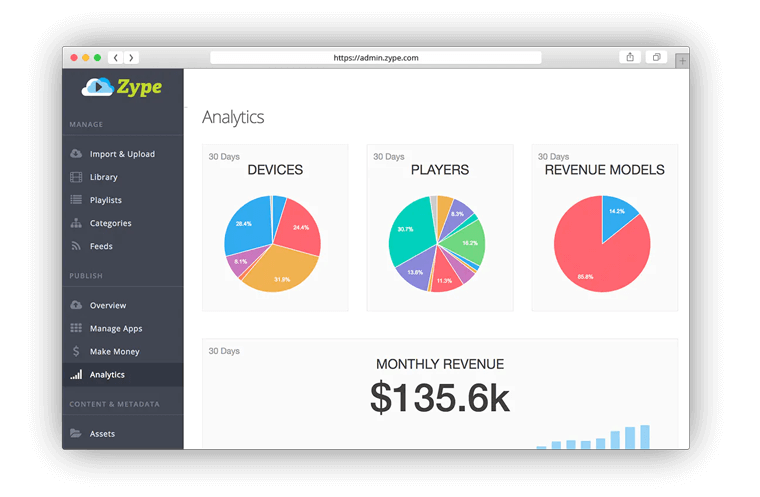
Devices breaks down the percentage of player impressions by device (Desktop, iPhone, Android, Roku, etc.) over the last 30 days.
Players breaks down the percentage of player impressions by player type (YouTube Player, Vimeo Pro Player, Vimeo Pro AFTV Player, etc.) over the last 30 days.
Revenue Models shows the percentage of player impressions by revenue model (Free, SVOD, AVOD, etc.) over the last 30 days.
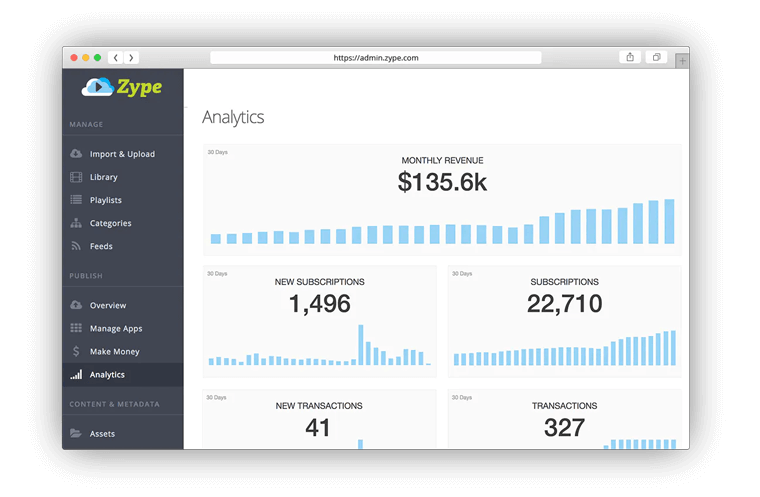
Monthly Revenue displays your total monthly recurring revenue for the last 30 days.
New Subscriptions shows net new subscribers that have registered via Zype and are paying to access your content over the last 30 days.
Subscriptions displays the total number of subscribers that are paying for access to your content and have registered via Zype.
New Transactions shows net new transactions (Purchase, Rental, Pass Plan and Redemption Code) over the last 30 days.
Total Transactions displays the total number of purchases, rentals, pass plans, etc. over the last 30 days.
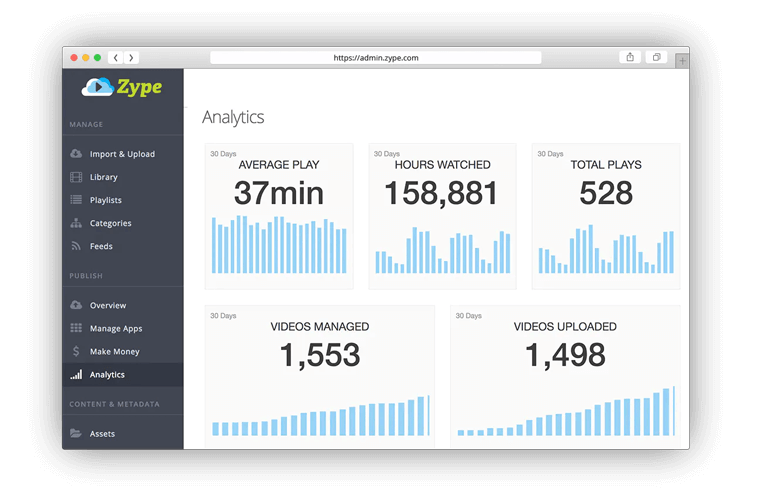
Average Play shows the average number of video plays (user clicked or autoplay triggered) in minutes per stream over the last 30 days.
Hours Watched displays the average number of video hours (user play or autoplay triggered) watched per day over the last 30 days.
Total Plays combines the total number of video plays (user clicked play or auto play was triggered) per day over the last 30 days.
Videos Managed tells you the total number of videos you are managing in your Zype library.
Videos Uploaded tells you the total number of videos you've uploaded directly to Zype.
Streaming Hour Analytics
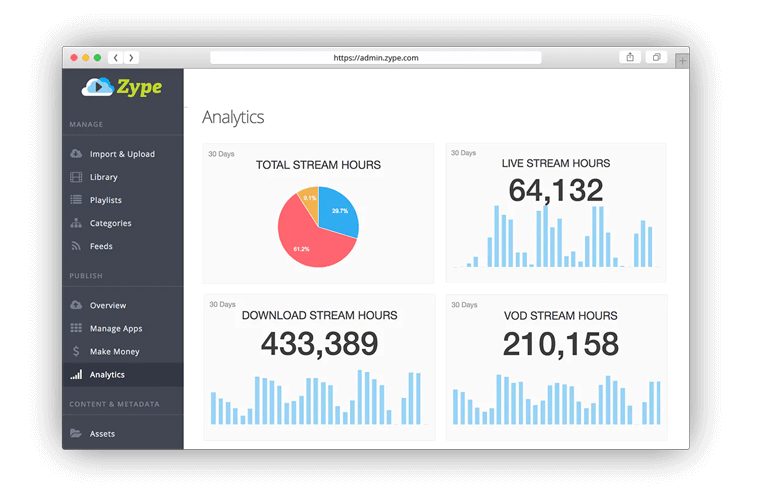
Total Stream Hours shows the total number of stream hours (VOD, Download and Live) for all content.
Live Stream Hours will display the total number of hours streamed if you are utilizing Zype Live for live events.
Download Stream Hours shows the total number of hours streamed for downloadable content. If you have iPhone and Android devices with Zype, download stream hours will be applicable.
VOD Stream Hours shows the total number of hours streamed for video on demand (VOD) content.
You can even go deeper by clicking into any of the metrics above, picking a date range and exporting the data to share with your team and important stakeholders.
And because we understand your video business runs on data, we’ve spent some development cycles going another layer deeper with reporting analytics on a consumer-level.
In Pt. 2 of the analytics dashboard, we’ll dive into our latest analytics additions and explore some of the deeper reporting Zype offers.
Which metrics mean most to you and your business?